The Edge Journal: Trading Journal Spreadsheet
The Edge Journal: Trading Journal Spreadsheet
Couldn't load pickup availability
- Instant download after payment
- Works in Excel, Google Sheets and Numbers
- One payment, yours to keep
Find out which half of the day is actually paying you.
I built this because of one spreadsheet column that changed how I trade.
I split AMD's price history into two halves: the hours the market is open, and the hours it is closed. Over the period I tested, the overnight half compounded at 53.8% a year. The intraday half returned nothing at all. I had been spending all my attention on the half that paid me zero.
Most traders never check this, because most journals don't split it out. This one does it automatically. It separates every result into the trades you close the same day and the ones you hold overnight, from nothing more than your entry and exit dates.
It also answers the two questions that come after. What breaking your own rules costs you in real dollars, and which position sizes are quietly wrecking a system that would otherwise work.
Win rate is in there too, but it is the least useful number on the page. You can win seven trades out of ten and still finish the year down. Expectancy and profit factor are the numbers professionals judge a trader on, and the dashboard works out both for you.
What you get
- Trade Log with 300 rows, dropdowns for asset, setup and mistake tags, and every calculation done for you
- Stocks, ETFs, options and futures, with contract size handled for you, so an options trade counts at 100 shares per contract
- Dashboard with win rate, expectancy, profit factor, average R, largest win and largest loss
- Equity curve that draws your account's path after every closed trade
- Where the money leaks, showing in dollars what happens when you break your own rules or size too big
- What each mistake costs you, from moved stops to revenge trades, so you know which habit to fix first
- Intraday vs overnight, the split that shows which part of your trading actually pays
- By Symbol and By Setup breakdowns
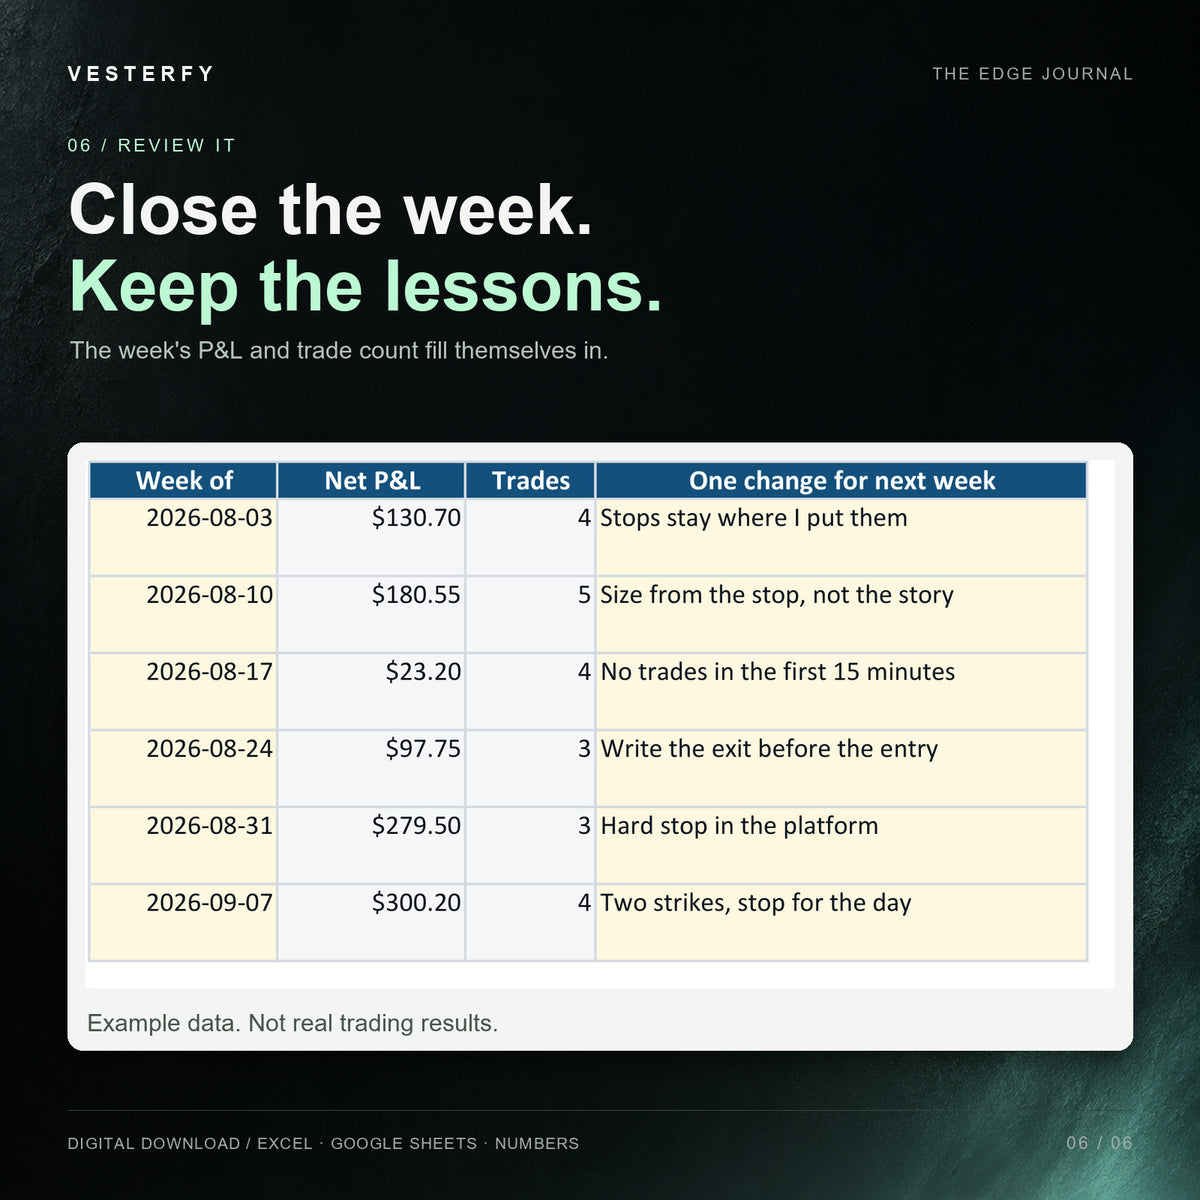
- Weekly Review tab with 52 rows, where each week's P&L fills itself in
Log a trade in about twenty seconds, then give it fifteen minutes on a Sunday. It works in Excel, Google Sheets and Numbers. There is nothing to install and no subscription. The file is yours to keep, and the download link arrives the moment you check out.
The AMD finding describes one stock over one historical period. It is not a prediction, and it is not advice to trade overnight. Past results do not guarantee future ones.
How you get it
How you get it
After payment your download link appears on the order confirmation page and arrives by email. Nothing is shipped.
Open the file in Microsoft Excel, Google Sheets or Apple Numbers. In Google Sheets, use File then Import to open it.
Questions about the file? Email vesterfy@gmail.com.
Share